Wardley mapping
Introduction
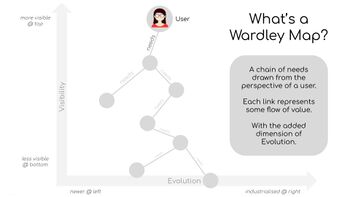
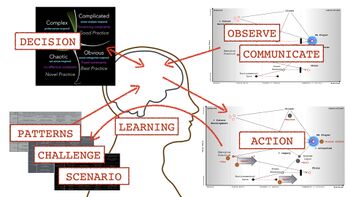
Wardley Maps (aka Value Chain Maps) offer a form of cartography to organisations. In Cynefin terms, they are both a complicated sense making framework, and a modelling method. Briefly, a map contains a chain of needs drawn from the perspective of a user, with the added dimension of Evolution. By visualising competitive landscapes, Wardley Maps can be used to improve situational awareness, develop & communicate strategy, and guide organisational design. Simon Wardley explains that what we commonly call "maps" – such as mind maps, business context views, architecture maps, etc. – are nothing like maps: the landscape is merely a canvas and positions have no meaning. With Wardley Maps, a position carries meaning making them unique and useful.
A Wardley Map is arranged on two axes. The Y-axis maps a value chain arranged by visibility to a user with aspects more important and visible to the user higher up and things of lower value or visibility lower down.
On the X-axis items are arranged based on their current evolutionary state, with more mature / evolved items on the right:
- Genesis - where new ideas are created or exapted - R&D and new innovations
- Custom - where new products emerge, are adapted to the needs of and find momentum with clients - selling what the client will buy; or internal products where no other commercial offer exists and where they are integral in support of the organisation's differentiation
- Product / Rental - where there is sufficient repeatability to consolidate and scale the products/services - selling ready-made solutions
- Commodity - a place of intense competition where there are fewer possibilities of differentiation, and competition involves scaling and dominating the market. This is also the place of platform strategies and enabling technology.
We also see different types of people associated with these stages of evolution. We are likely to see "pioneers" who are the primary innovators associated with genesis and custom builds, "settlers" associated with products, and "town planners" associated with commodities.
Maps are very user-centric. Capturing a map starts with the anchor: the user and their needs. Then, we map and connect the supporting value chain against the landscape of visibility and evolution. It visualises the context of the value chain to help with understanding challenges or limitations and making strategic choices accordingly.
Value chains also represent flows of value. As many organisations look to shift away from silos, maps are also a very useful way to identify and establish end-to-end value streams.
Also included within Wardley Maps are:
- a strategic cycle made of purpose, landscape, climate, doctrine, leadership and inspired by "the Art of War" from Sun Tzu and the [OODA loop]
- a set of "climatic patterns" that show how landscape typically changes
- a set of "inertia patterns" that slow organisations and/or industries in progressing their level of maturity
- a set of "context specific gameplay" that detail actions an organisation or its competitors may make
- a set of universally applicable principles called "universal doctrine"
Similarities & Differences to Cynefin®
Wardley's Evolution & Cynefin® Domains
Wardley's Evolution is commonly confused with Cynefin's Domains, assuming the Stages of Evolution can be directly mapped onto a single domain, similar to the linear construction of Cynefin®. Eg:
| Cynefin® Domain | Chaotic | Complex | Complicated | Clear |
| Wardley Evolution | Stage I (Genesis) | Stage II (Custom) | Stage III (Product) | Stage IV (Commodity) |
While this can be useful at times, they are fundamentally different concepts and there is no one-to-one mapping. To illustrate this:
- Stage IV Commoditised components like Electricity are Complicated to produce, but Clear to consume.
- Failure of a Commoditised component can wreak havoc on its consumers, plunging them into Chaos.
- Deciding what to do about a Commoditised component could be Complex, Complicated, Clear, or Chaotic.
This confusion is rooted in a similarity between the two frameworks: certainty. Wardley's Evolution is a pattern of change that approximates two factors:
- Ubiquity: how widely used a component is in its applicable market
- Certainty: how complete, well-understood, and fit for purpose a component is
As components become more certain they tend to become more ordered, and that is the key link to Cynefin®. But it stops there: a component that becomes more ordered does not necessarily become more ubiquitous, and order can be represented on a Wardley Map in different ways (eg: between components at different stages of evolution). Finally, this simplified linear view of Evolution hides the complex non-linear path a component actually takes. Wardley notes that the movement towards the right on the map is generally also complex, with stabilizing practices like automation, standardization and regulation being emergent.
Thus, the evolution typologies loosely echo the domains of Cynefin® as if there’s a prevailing wind of decision style for a given Stage of Evolution that is easily overridden by other context.
One such mapping is the different types of Wardley's Practices and constraints associated with each domain:
- Chaotic - The domain of novel practices, in which agents have nothing to lose, maps to novel concepts and solutions for urgent problems and opportunities. The Shallow Dive into Chaos is easily applicable, with unconstrained brainstorming and fast prototyping allowing the genesis of new concepts and potential products. Cynefin®'s Chaos Grazing dynamic is similar to the culture of tightly funded start-ups or other organizations facing urgent threats, with new ideas being stabilized just enough to release.
- Complex - Emergent practices and enabling (contextual) constraints map to evolving prototypes customized for user and customer need and feedback, with techniques like proofs of concept and alpha / beta releases providing safe-to-fail probes. The culture of organizations like start-ups change, with the gentler Stable Dynamic in play as iterative changes to the product cross the Complex / Complicated liminal.
- Complicated - Good practices map to expertise around relatively stable products or rental services; governing constraints map to product standards and regulation.
- Clear - Best practices and fixed constraints map to industry standards and regulation, with fungible commodities that are easy to use and understand solving different categories of problem. Profit margins on these products are small and economies of scale dominate, allowing only a few survivors to dominate ("Last Man Standing").
- Confused - This correlates to the misapplication of practices, like a universal rollout of a change to a stable product when the change has not properly been tested / probed, or applying the risk-averse culture of a large traditional bank to a small start-up. As with all instances of disorder, when such misapplication persists, chaos is the result.
Another mapping is derived from the “Decision Drivers” of Wardley’s Evolution Cheat Sheet:
- Stage I: Heritage / Culture. This has no direct link, but can be loosely linked to the Complex domain's "Probe - Sense - Respond".
- Stage II → III: Analysis & Synthesis. This aligns closely with the Complicated domain's “Sense - Analyse - Respond”.
- Stage IV: Previous Experience. This aligns with Clear domain’s “Sense - Categorise - Respond”.
Landscapes
Maps offer the concept of connected value chains against a landscape where positions and movement have meaning. Patterns also exist:
- Inertia as the friction to the movement within an enterprise or the industry (see Fitness Landscapes)
- Climate as the movement of the industry/context
- Doctrine as the organisation heuristics which can support or bring drag to adapting
- Gameplay as strategic plays to gain advantage by adapting to / accelerating / slowing the movement & climate
Wardley maps are analytical
Cynefin® is non-analytical in nature, whereas Wardley Maps are created through analysis.
Similarities & differences with Flexuous Curves
Wardley Maps have often been associated with the concept of Flexuous Curves, and both are dealing with strategy.
Flexuous curves are based on how an idea crosses its chasm of adoption and evolves into the mainstream, eventually rendering the incumbent offering obsolete, and potentially generating a complacency-induced failure of the incumbent suppliers.
Dave has often argued that the criteria for a strategic framework is that it can be drawn on the back of a napkin. Flexuous curves achieve this. Maps require more investment in understanding, though once people have gone over the hurdle of thinking in terms of maps and share this mental model, you can map on a napkin too. Another useful concept in Wardley Maps is the evolution and the diffusion curves.
In Wardley Maps, we need to think in terms of the two concepts:
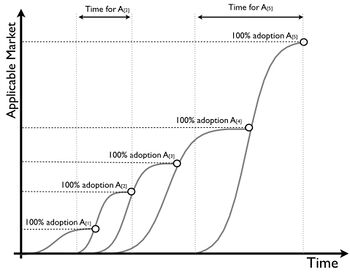
- The diffusion curve - This answers the cycle of step improvement beyond a simple feature iteration of a product. It is supported by climatic pattern: Efficiency enable innovation
- The maturity evolution / states and the various stages & inertia between the states. It is supported by the climatic pattern: Everything evolves through supply and demand competition.
In Wardley Maps, disruption from a new idea generally starts with a diffusion curve. An improvement offers a step-change to the market offering, beyond a simple feature iteration on the adoption curve, it is in fact starting a new curve with its new adoption cycle.
For some time, the old curve continues to progress in adoption until the new curve catches up.
The new curve needs to start from the beginning and find its customers. From the early pioneers to crossing the chasm and getting momentum. When the new curve catches up in adoption with the old curve it renders the old obsolete and takes over.
If the incumbents of the old curve have not adapted to the new product/curve, they are facing complacency induced failure by the time the new curve catches up in adoption. The old curve winds down and reaches 100% of its possible adoption. The new curve continue to progress and takes over as well as expands the market.
As an example, the mobile phone market was pretty much set with established players and Nokia's dominance. Product iterations were regular in the same format as a usual phone with design differences, some new features, etc. When Apple launched the iPhone, it was a new diffusion. The change was substantial enough that it was a new diffusion curve, which had to progress to full adoption. We know the rest, eventually the new curve overtook the old one and SmartPhone have overtaken and replaced the classic phone market, while at the same time driving a degree of adoption beyond what was the original mobile phone market.
The combination of the diffusion and the evolution covers the same space as the flexuous curves. Wardley Maps are useful in this case to dive into the details of the movement / inertia / climate supporting the crossing of the chasm and the disruption of the incumbents.
Complementary use with Cynefin®
When people map the landscape of things, such as systems, features, outcomes on the Cynefin® framework, there would be significant overlap with Wardley Maps. However it is not the best use of Cynefin® and maps may offer a better approach when mapping such "things".
When looking at making sense of a situation with a view to make decisions, Cynefin® is more adapted to capture such situations and offers more possibilities for navigating situations of complexity, chaos, confusions and ambiguity.
Wardley Maps are very adapted to map the physical / rational landscape, while Cynefin® offers a sense making approach to the cognitive landscape. As such both are highly complementary.
"Wardley maps offer a map of the landscape, Cynefin® supports establishing an appropriate direction to support making sense of decisions".
Workshop techniques / Training
<include>
SenseMaking position on maps
The intention of this section is not to explain in full details how to do a Wardley Maps (there are many links at the bottom of this section and provide such information), but to touch on an aspect directly relevant to Cynefin® such as SenseMaking the position on the maps.
When Wardley looked to find a way to inform where things should be on a map scarcity was an initial consideration. He then took the example of a gold bar, which is scarce as not many people have one. But would we say that a gold bar is something novel that can evolve further? Not so much. It is in fact quite commoditised and has been for some time, despite being rare and scarce. This led him to conclude that scarcity was not a suitable factor to gauge map positions.
He then looked at technology. Would technology be a good indicator of innovation and positions on maps? Mobile smartphones are highly sophisticated technological products. Yet, they are now rather ubiquitous, many manufacturers are producing them with comparable features and there is competition on price. This sounds more like items that are already quite commoditised. Technology by itself is not a deciding factor for positions on a map.
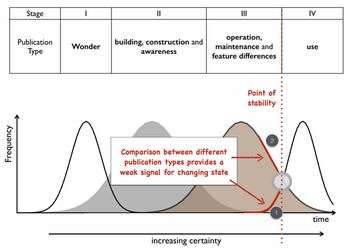
He then proceeded to look at publications about innovation through the centuries and noticed how the description of a novel product/service would evolve over time:
- It started with a state of "Wonder" when the novel product/service is presented as a wonder opening many possibilities
- Then is evolved to a state of "Peace" when the product/service is more commonly referred for its uses and on-going feature improvements
- Finally it reaches a state of "War" when the suppliers of the product/service are aiming for market domination, triggering a consolidation & scaling of the offering. The product/service is not featuring much anymore in publications, except when it fails (eg. a network operator going down).
Please see figure 1 for evolution by publication types.
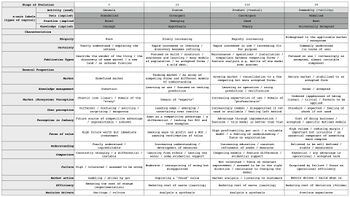
Note - It is worth noting that maps mainly happen in the known domain and making sense of position is an analytical process of matching components with the stages of evolution documented in the commonly called "cheat sheet". Some study is currently happening to consider the use of SenseMaker® with maps. One use would be to spot weak signals earlier and stronger for novel components to appear in genesis and their gaining adoption momentum to start their progress through the map. Please see figure 2 for the stages of evolution or cheat sheet.
References
- Simon Wardley's book on Medium: Value Chain mapping technique, and associated theories. https://medium.com/wardleymaps/
- Simon Wardley's blog - https://blog.gardeviance.org/2020/
- Simon Wardley's prolific Twitter feed - https://twitter.com/swardley
- Wardleypedia, the Wardley mapping wiki - https://wardleypedia.org/mediawiki/index.php/Main_Page
- Learn Wardley Maps by Ben Mosior - https://learnwardleymapping.com/
- Introduction to Wardley Maps by Steve Purkis, presentation published on slideshare - https://www.slideshare.net/spurkis/introduction-to-wardley-maps
- Article on Bringing strategy into your digital transformation, by Philippe Guenet and Nigel Thurlow, published on Planet Lean - https://planet-lean.com/strategy-lean-digital-transformation/
- Robert X. Cringely, Accidental Empires, 1993. Cringely described how there were three different types of companies known as infantry, commando and police from which the idea of pioneers, settlers and town planners were derived
- The Wardley Maps Community Hub. https://list.wardleymaps.com/
