New feature requests that may not be simple
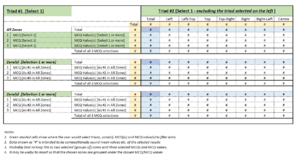
Data Table for Comparison of Compositionally Sound Means for Different Cohorts
The table shown below has been discussed with Peter as an idea that may be helpful for workbench users who want to identify the impact on compositionally sound means of filtering responses in one or more zones in Triad 1 by specified values in one or more MCQs and by their zone in Triad 2. While the table shown below includes a # symbol in each cell indicating numerical values associated with the mean of the different filtered cohorts in Triad 1, these numbers could be augmented or replaced by their associated tern diagram. All of these diagrams would be for different cohorts in Triad 1. Possible use cases for this idea include answering the following questions: 1. What are the differences between compositionally sound means of responses provided by male and female respondents in different zones in Triad 1? (This uses just the vertical 'Total' column shaded in yellow). 2. What are the differences between compositionally sound means of responses provided by male and female respondents in different zones in Triad 2? (This uses the full table or as much of it as is needed for the selection of zones in Triad 1)
